In today’s rapidly evolving industrial landscape, measuring workplace safety goes far beyond counting accidents after they happen. Forward-thinking organizations understand that a truly effective safety management system must be both reactive and proactive, addressing risks before they escalate into incidents. This is where leading and lagging safety indicators play a transformational role. Together, they give EHS managers a complete, data-driven picture of their organization’s safety performance, helping teams not only respond to incidents but predict and prevent them.
In this blog, we break down the 10 most critical safety indicators every company should be tracking, explain what sets leading and lagging indicators apart, and show how integrating them into your EHS strategy can dramatically improve workplace safety outcomes.
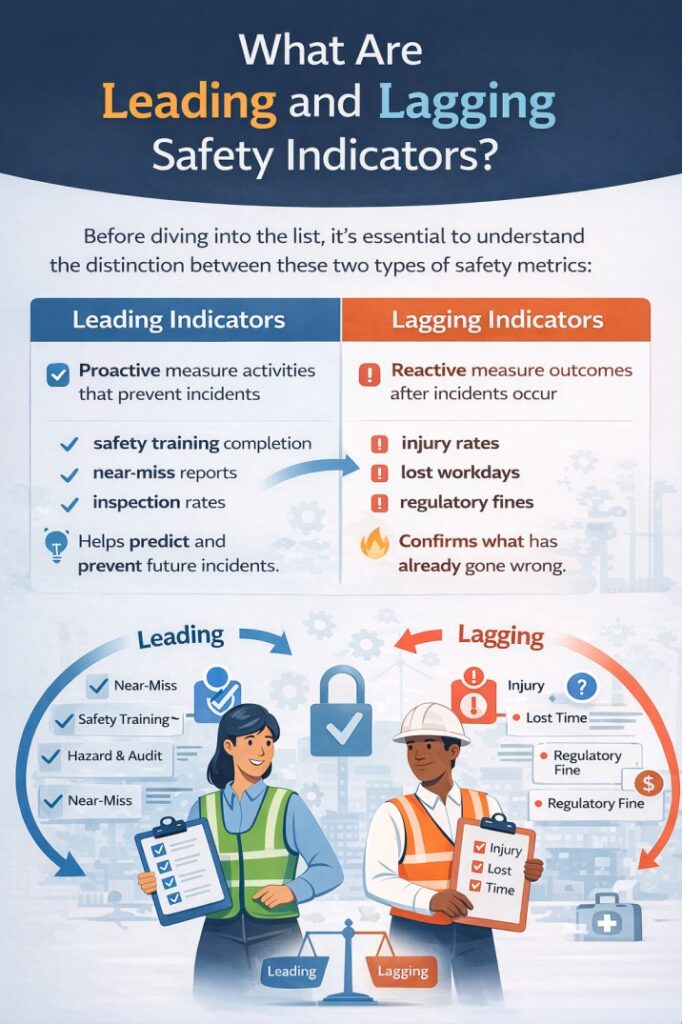
What Are Leading and Lagging Safety Indicators?
The 10 Key Safety Indicators Every Company Should Track
PART 1: 5 Leading Indicators (Proactive Measures)
1. Safety Training Completion Rate
What it measures: The percentage of employees who have completed required safety training programs within a defined period.
Why it matters: Untrained employees are significantly more likely to be involved in workplace accidents. Tracking training completion ensures your workforce is equipped with the knowledge to identify hazards, follow safe work procedures, and respond to emergencies effectively.
How to improve it: Use automated reminders and a centralized EHS training management platform to track, assign, and escalate incomplete training. Digital platforms enable managers to see real-time completion dashboards and close gaps proactively.
2. Near-Miss Reporting Rate
What it measures: The frequency at which employees report near-miss incidents, events that had the potential to cause harm but did not.
Why it matters: Research consistently shows that for every serious injury, there are hundreds of near-misses that go unreported. Near-miss reports are goldmines of risk intelligence. A high near-miss reporting rate isn’t a red flag, it’s a sign of a healthy safety culture where employees feel safe speaking up.
How to improve it: Make reporting frictionless with mobile-first incident reporting tools. Encourage a non-punitive reporting culture so employees aren’t afraid to flag close calls.
3. Safety Audit and Inspection Completion Rate
What it measures: The percentage of scheduled safety audits and workplace inspections completed on time.
Why it matters: Regular audits identify hazards before they become incidents. A low completion rate signals that safety checks are being skipped, leaving vulnerabilities undetected and compliance requirements unmet.
How to improve it: Automate audit scheduling, assign ownership clearly, and use digital audit tools that allow on-site teams to complete inspections from mobile devices with photographic evidence. Integrate CAPA workflows directly into audit findings to close the loop faster.
4. Corrective and Preventive Action (CAPA) Closure Rate
What it measures: The percentage of identified corrective and preventive actions that are resolved within their target timeframes.
Why it matters: Identifying a hazard is only half the battle. If corrective actions remain open indefinitely, the underlying risk persists. CAPA closure rate directly reflects how effective an organization is at following through on safety improvements.
How to improve it: Implement a digital CAPA management system with automatic escalation, deadline tracking, and accountability assignment. Use root cause analysis tools like the 5 Whys or Fishbone Diagram to address problems at their source, not just the surface.
5. Safety Observation and Hazard Identification Rate
What it measures: The number of safety observations, both positive and negative behaviors, recorded by employees and supervisors per month.
Why it matters: Active observation programs engage the entire workforce in hazard detection. When employees are encouraged to observe and report, potential risks are surfaced early. A high volume of safety observations correlates strongly with fewer serious incidents.
How to improve it: Deploy a simple, accessible hazard reporting tool accessible via mobile. Reward employees who contribute observations, and ensure that reported hazards are visibly acted upon, demonstrating that speaking up makes a difference.
PART 2: 5 Lagging Indicators (Reactive Measures)
6. Total Recordable Incident Rate (TRIR)
What it measures: The number of OSHA-recordable work-related injuries and illnesses per 100 full-time employees per year.
Why it matters: TRIR is one of the most widely used industry benchmarks for comparing safety performance across organizations and sectors. It is a fundamental regulatory metric and is often reviewed by clients, insurers, and regulators.
Formula: TRIR = (Number of Recordable Incidents × 200,000) ÷ Total Hours Worked
7. Lost Time Injury Frequency Rate (LTIFR)
What it measures: The number of injuries resulting in at least one lost workday per million hours worked.
Why it matters: LTIFR reveals the severity of workplace injuries by focusing specifically on incidents significant enough to keep employees away from work. It is a critical indicator for insurers and reflects the depth of workplace safety failures.
Formula: LTIFR = (Number of Lost Time Injuries × 1,000,000) ÷ Total Hours Worked
8. Severity Rate (Average Days Lost)
What it measures: The average number of workdays lost per incident due to injuries or illnesses.
Why it matters: Two companies may have the same LTIFR, but one may be losing 2 days per incident while another loses 20. The severity rate captures this distinction, revealing not just how often injuries occur but how serious they are when they do.
How to use it: Track severity rate over time to identify whether injury types are becoming more or less serious, and investigate spikes promptly for systemic causes.
9. Workers' Compensation Cost per Employee
What it measures: The total workers’ compensation costs incurred by the organization, expressed per employee or per hours worked.
Why it matters: This indicator translates safety performance into direct financial impact, making it a powerful metric for communicating the ROI of safety investments to senior leadership. High compensation costs are a clear signal that safety programs need reinforcement.
How to use it: Benchmark against industry averages. Use the data to build a compelling business case for EHS technology investments, demonstrating that every rupee spent on prevention reduces compensation costs significantly.
10. Regulatory Violations and Non-Compliance Rate
What it measures: The number of regulatory violations, penalties, or non-compliance findings issued against the organization within a defined period.
Why it matters: Regulatory violations are among the most concrete and costly lagging indicators available. They reflect gaps in compliance safety management, expose organizations to fines and legal liability, and damage organizational reputation. Monitoring this metric helps prioritize compliance improvement efforts.
How to improve it: Implement an automated compliance management system that tracks regulatory requirements, generates reminders for upcoming deadlines, and maintains a digital audit trail for inspection readiness at all times.
How to Use Leading and Lagging Indicators Together Effectively
The real power of safety indicators is unlocked when leading and lagging measures are used in concert. Here is how progressive organizations approach this:
- Set baselines: Establish current performance levels for each indicator before setting improvement targets.
- Create a balanced safety scorecard: Combine 3–5 leading and 3–5 lagging metrics into a single dashboard reviewed monthly by leadership.
- Look for correlations: Use analytics tools to identify whether leading indicators (such as near-miss reporting) are predictive of lagging outcomes (such as injury rates) in your specific environment.
- Drive accountability: Assign ownership of each indicator to specific roles and departments, making safety performance part of regular operational reviews.
- Leverage AI-powered analytics: Modern EHS software platforms use artificial intelligence to identify risk trends across large data sets, predicting where the next incident is most likely to occur before it happens.
How EHS4Safety Helps You Track What Matters Most
At EHS4Safety, we understand that great safety data is meaningless without the systems to collect, analyze, and act on it. Our AI-integrated EHS software platform is purpose-built to help organizations manage both leading and lagging safety indicators from a single, intuitive dashboard.
With EHS4Safety, your team can:
- Log and track near-miss reports instantly via mobile devices
- Automate safety audit schedules and receive real-time inspection results
- Manage CAPA workflows from root cause identification to closure verification
- Generate TRIR, LTIFR, and severity rate reports with a single click
- Monitor compliance deadlines and regulatory requirements across multiple sites
- Leverage AI-driven risk insights to predict incident trends before they materialize
Conclusion
Tracking safety indicators is not about compliance box-ticking, it’s about building a workplace where every employee goes home safely every day. By combining proactive leading indicators with reflective lagging indicators, organizations create a continuous feedback loop that drives genuine, measurable safety improvement.
The companies that excel at safety are not the ones that react fastest after an incident, they are the ones that prevent incidents from happening in the first place. And that starts with measuring the right things.